.webp)
How to benchmark your restaurant performance and why it matters more than ever

Here’s a harsh truth: you can know your numbers inside out and still have no idea where you actually stand in the market.
You might check sales and labour every morning. You might know which venue had a strong week and which one struggled. You might even feel in control of your P&L.
But until you compare your numbers to similar operators, you’re operating in the dark.
Your GP might feel fine. Your labour might look stable. Your review score might seem pretty good.
But is it?
You only find out when you see your results alongside a real industry range: lowest → highest → your exact position.
This gap in context is one of the biggest blockers to profitability in hospitality today. The good news is that benchmarking changes that.
Keep reading to find out how benchmarking gives you industry context, sharper decision-making, and clearer path to higher profits.
Key takeaways
- Restaurant benchmarking shows how your performance compares to similar operators, revealing where you stand in the real-world industry range.
- It gives clarity to decision-making, helping you focus on actions that truly improve profitability.
- Without benchmarks, you risk misdiagnosing issues, but Nory shows exactly where to prioritise improvements.
- See your restaurant’s performance in context and try the Nory benchmark today.
What is restaurant benchmarking?
Restaurant benchmarking shows exactly where your results sit within the real-world spectrum of similar operators.
When you benchmark your performance against the rest of the market, you can see:
- If your gross profit is healthy for your category
- Whether your labour costs are drifting or on target
- If your customer review rating is in line with similar operators
- Where you sit in the industry’s lowest-to-highest range
Targets stop feeling like guesswork, decisions become simpler, and you finally know what ‘good’ actually looks like. As a result, you can focus your time and energy on the levers that matter most.
How does range-based benchmarking work?
Range-based benchmarks offer a full picture of how the market is performing by showing three key data points:
- The lowest result in the industry range (lowest GP, highest labour %, lowest review score)
- The highest result in the industry range (top performers)
- Your exact position inside that range
Instead of telling you an average or giving you a single target, range-based benchmarking shows the entire spectrum of performance for operators based on real data from the market.
If you’re looking at a metric like gross profit, labour cost, or even customer reviews, a range-based benchmark shows you:
- What bad looks like
- What great looks like
- Exactly where you sit between the two
We know that profit margins shift quickly and often in hospitality. A few points of labour creep or a dip in GP can be easy to miss in isolation. But when you see that number plotted inside a real industry range, the context becomes obvious.
You immediately understand whether you're outperforming, falling behind, or sitting comfortably in the middle. That clarity helps you set more accurate targets and take action with purpose.
Why benchmarking matters for food operators
Hospitality moves fast, and margins move even faster. A two percent shift in labour, a little excess prep, or a handful of poor customer experiences can influence your P&L statement almost overnight.
Operators feel these fluctuations constantly, but most don’t know how their numbers compare to the wider market.
This is where benchmarking brings immediate clarity.

Percentages only make sense when you know where they sit in the real-world spectrum. Seeing your numbers alongside the industry range immediately shows whether you’re closer to the top performers, somewhere in the middle, or sitting lower than you realised.
From here, you get a clear idea of what improvements you can make to match or exceed industry averages.
For example, if your gross profits look stable at 65% but the industry range for your category sits between 70-75%, you instantly know you’re leaving money on the table. That gap becomes a clear opportunity for growth, and you can prioritise your efforts accordingly.
The cost of operating without benchmarks
Making decisions based solely on your internal numbers means missing out on crucial context. You might think you’re performing well when you’re actually falling behind.
Without a clear industry reference, it’s easy to misallocate resources, set the wrong targets, and miss hidden opportunities. Benchmarking gives you the confidence to act confidently and focus on areas that truly impact your bottom line.
Here are some of the most common pitfalls when operators lack benchmarks:
Chasing the wrong problem
Without benchmarks, your team can spend weeks or months optimising an area that’s already performing well, while a bigger issue quietly eats into profitability. Benchmarking ensures that you know which of these metrics truly needs attention.
- Without benchmarking: A restaurant notices labour costs are high and immediately cuts hours. Diners then have a worse experience during peak times because there aren’t enough staff to meet demand. Meanwhile, gross profit sits well below industry norms, but nobody notices because there is no external reference.
- With benchmarking: You can see that labour costs are actually on par with top-performing operators, but your GP is 10-15% below peers. You refocus efforts on pricing, portioning, and menu engineering to increase your GP and boost revenue.
Setting unrealistic or conservative targets
Operators often create goals based on gut feeling or internal history rather than real market performance. Benchmarks reveal whether these goals are aligned with what top operators achieve in real conditions.
- Without benchmarking: Your monthly GP target is 68% based on last year’s numbers, but top performers in your area achieve 78%. Without seeing that range, you settle for a lower target rather than pushing for a similar performance to your top competitors.
- With benchmarking: With a benchmark in place, you see that 68% puts you near the bottom of the GP spectrum. As a result, you adjust targets, refine menu pricing, reduce waste, and optimise portions to close the gap.
Misdiagnosing performance drops
When a venue sees a sales dip, operators often assume it’s an internal issue. Maybe staff weren’t efficient, the menu wasn’t selling, or marketing fell short?
Sometimes, the drop is actually part of a wider market trend that requires a different response, like local events.
- Without benchmarking: A café sees a 12% decline in weekend sales and assumes something is wrong internally. They adjust prices and menu items, but the real cause is a citywide festival that shifts foot traffic elsewhere.
- With benchmarking: By comparing performance to other similar venues in the city using benchmark data, the operator immediately sees that others experienced the same dip. The insight allows them to respond appropriately rather than making unnecessary operational changes.
Inconsistency across sites
Your best-performing venues can mask underperformance elsewhere. Teams can compare sites internally, but strong locations skew the perception of what’s normal.
Benchmarks, however, reveal variances more clearly than internal comparisons. They cut through the uncertainty, giving operators the clarity they need to act confidently, communicate clearly, and stay ahead of problems rather than reacting to them.
- Without benchmarking: A multi-venue restaurant has one superstar location with a GP of 75%. The other three locations are at 60-62%. Comparing internally and gathering GP averages, performance looks okay. However, the operator misses the fact that the majority of sites are underperforming.
- With benchmarking: Seeing each site’s performance against the industry range instantly flags underperforming venues. As a result, they can allocate resources, training, or menu adjustments to lift weaker site performance.
How benchmarking improves decision-making
When operators plot their numbers with the full lowest-to-highest industry range, they move from guesswork to clarity.
So how does this influence decision-making?
Put simply, decisions become grounded on real-world context rather than assumptions.
Instead of guessing whether a gross profit of 68% is acceptable or if labour costs at 34% are too high, operators can see how they stack up against similar venues. This clarity allows them to act confidently, prioritise the right levers, and focus on improvements that actually increase revenue.
Here are some examples of how benchmarking guides smarter decisions:
- Reset targets when gross profit sits below the industry baseline. If your GP is 60% and similar venues hit 70-74%, you realise your previous targets were too low. Benchmarking highlights the gap and shows exactly where to improve.
- Optimise staffing on slow midweek periods. Instead of blindly scheduling the same team every day of the week, benchmarking reveals where you can cut hours without impacting service or efficiency.
- Identify where labour costs are healthy. You can see which venues already operate efficiently, so you avoid unnecessary cuts that hurt staff morale or service quality.
- Understand why one venue outperforms another. Benchmarking reveals which practices (like menu design, upselling, or table turnover) drive better results, so you can replicate them across other locations.
- Spot customer experience issues. If your reviews sit at 4.2 while competitors average 4.6-4.8, benchmarking shows you exactly where to focus on staff training, service consistency, or menu tweaks.
- Give teams a clear standard to aim for. Benchmarking replaces vague goals with concrete targets, helping staff understand what good performance looks like.
To sum it up: Benchmarking removes blind spots, cuts through assumptions, and gives you the insight to make smarter, faster, and more confident decisions.
3 restaurant metrics you should be benchmarking
Operators often track dozens of KPIs, but only a handful truly determine whether a restaurant is profitable and performing well. Benchmarking works best when it focuses on these core metrics:
1. Gross profit (GP)
Your GP tells you whether pricing, menu engineering, portioning, and cost control are working. However, only benchmarking tells you whether your GP is healthy for your category.
If your number sits well below your category’s lowest benchmark, you know there's a significant opportunity.
Example: If your GP is 64% and the industry range for your category is 68%-78%, you instantly see that you’re sitting outside the healthy zone, even if the number feels reasonable in isolation.
How to benchmark your GP:
- Compare your GP to your category’s lowest and highest performance range.
- Track how recipe changes, supplier pricing, and portion sizes move you up or down the spectrum.
- Use weekly and monthly benchmarking to make sure improvements are actually sticking.
2. Labour cost percentage
Labour costs are always one of the biggest expenses in a restaurant. As a result, it’s hard for operators to know whether these costs are normal or out of line with the rest of the market.
Benchmarking cuts through that uncertainty by giving you clear visibility. It shows exactly where your labour percentage sits within the real industry range so you can see whether you’re operating efficiently or drifting into risky territory.
.webp)
Example: Your labour costs sit at 33%. If the category range is 28%-34%, you know you’re at the higher end and that it’s worth keeping an eye on.
How to benchmark your labour cost percentage:
- Compare labour cost percentage across similar operators in your area, cuisine, and service style.
- Monitor whether your position improves after schedule tightening or demand forecasting (which you can do using Nory).
- Use trends in the range to anticipate seasonal creep before it hits your P&L.
3. Customer review ratings
Customer reviews directly impact footfall, repeat business, and brand reputation. Benchmarking reveals whether your guest experience is a genuine strength or if you’re sitting below the standard your competitors are setting.
Example: If your average Google review is 4.2 but competitors are hitting 4.5-4.8, there’s a gap that suggests a need for improvement in your consistency, speed, service or value*.
How to benchmark your customer review ratings:
- Benchmark review scores across on sites like Google and TripAdvisor for nearby restaurants of the same cuisine and price point.
- Track month-to-month shifts to spot operational issues before they show up in sales.
- Compare ratings at each location if you operate across multiple venues to understand consistency gaps.
Hot tip 🔥 Use tools like the Nory benchmark to automatically view your GP, labour cost percentage, and customer ratings alongside the live industry range for your city and category. See exactly where you sit in relation to your top competitors at a single glance.
*It’s worth noting that reviews can be subjective. What one customer values might not be important to another. However, the overall trends still tell a powerful story about customer experience and operational execution.
Introducing the Nory benchmark: A clear overview of your position
Nory was built from the daily realities of hospitality operations. Across hundreds of operators and thousands of venues, our restaurant management software processes live sales, labour, and review data across multiple categories and cities.
By anonymising and aggregating this data, we give operators something the industry has never had at scale:
A benchmark that shows your exact position across the three KPIs that matter most: gross profits, labour costs, and customer review ratings.
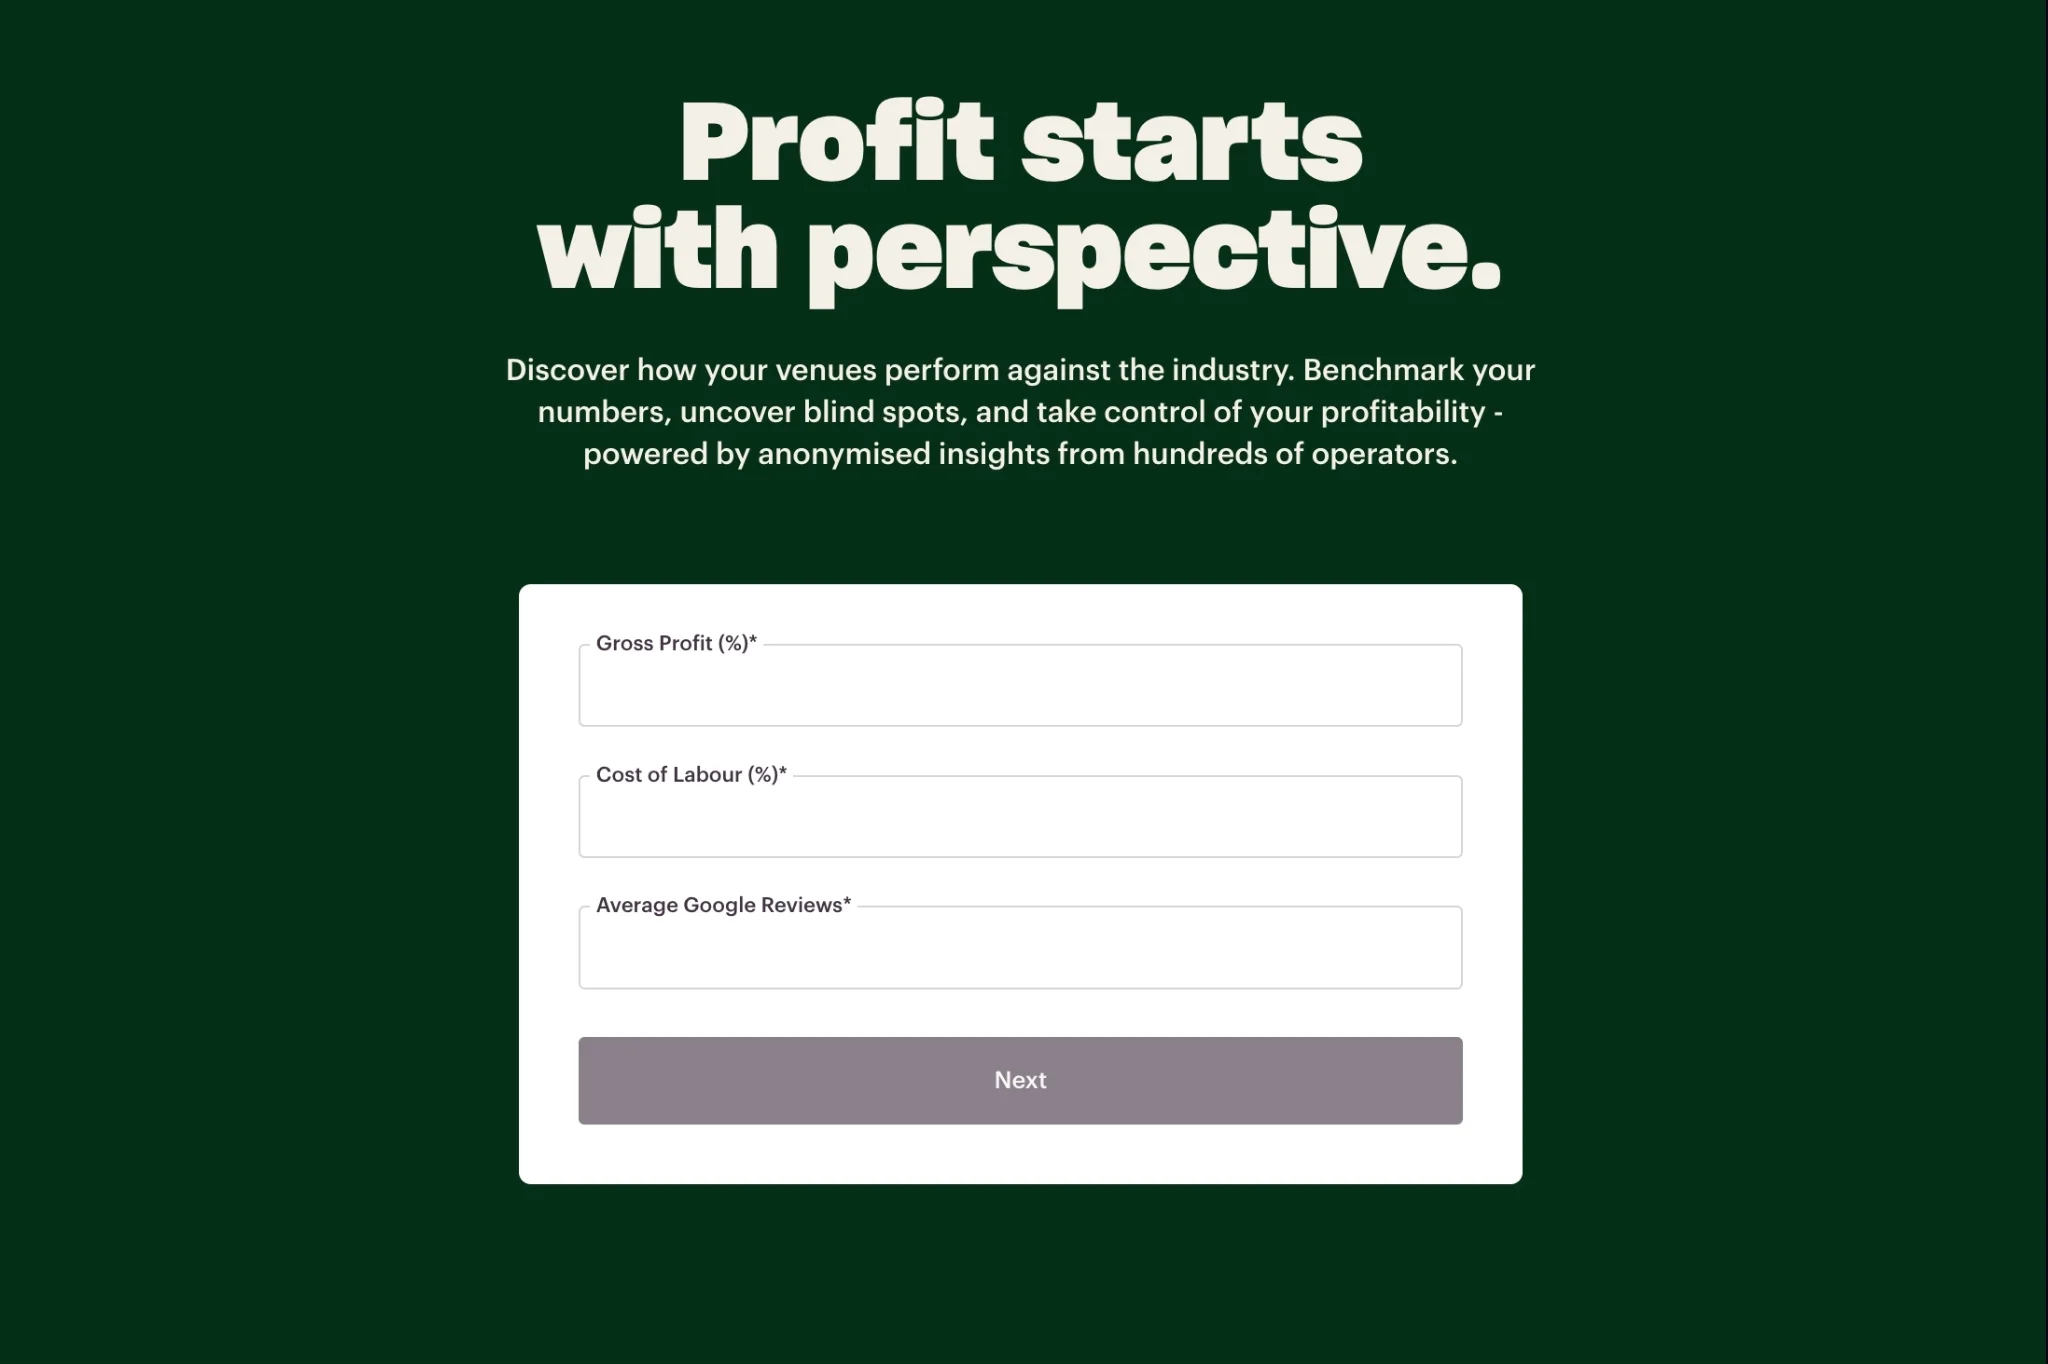
The Nory benchmark shows:
- Your number for each KPI
- The industry’s lowest and highest values
- Where you sit inside that range
- The level top performers consistently achieve
- The improvement operators typically unlock once they adopt Nory
No guesswork. No generic reporting, Just a clear, practical snapshot of where your performance sits in relation to competitors.
If you want to see your position and understand what’s realistically achievable next, start here.